• Skip to main content
  • Skip to primary sidebar

Better Bicycles

Science and cyclists making better bikes for transport and leisure

  • Mission
  • BriefBike
    • FAQ
  • About us
  • Contact
  • More
    • News
    • Research
    • Reviews
You are here: Home / Archives for Science

Science

Innovative light is safer for cyclists

19th June 2014 by Jody Muelaner Leave a Comment

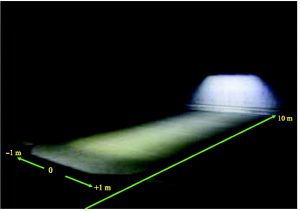
Bike lights should make the bicycle visible to other road users without causing glare and also illuminate the ground. Standards such as the European K-mark require that the first two conditions are met but do not require a very high standard of ground illumination. In the K-mark standard illuminance is measured at a distance of 10m from the light. Directly in front of the light the illuminance should be greater than 20 lux, at an angle of 3.4 degrees higher the illuminance should be less than 2 lux and towards the ground it should be greater than 2 lux. This is not sufficient to illuminate the ground. Achieving all three requirements requires a light to have a carefully designed illuminance pattern, which has not been achieved by commercially available lights.

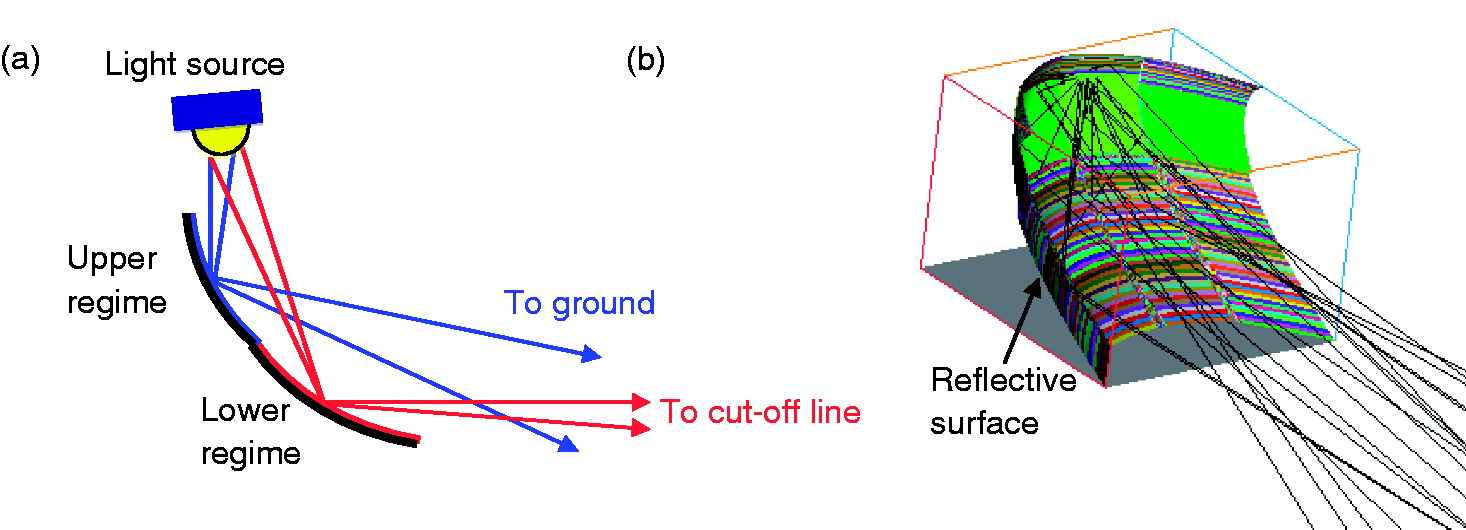
This study used ray tracing simulation to develop a light with the desired illuminance pattern and then validated the design experimentally. The novel design meets the requirements of the k-mark standard. It has an illuminance of 30 lux directly ahead and a clear cut-off so that the light at elevation angles of greater than 3.4 degrees is minimal and will not cause glare. The design also provides good illumination of the ground, with a maximum intensity of 9 lux and at least 3 lux up to 7 m from the light. It shows that the novel design provides safer illumination for a bicycle rider while only consuming 2.5 W of power.

Diagram showing ray paths on reflector
Reflector design

Abstract:

A novel design of phosphor-converted, white light emitting diode-based bicycle head lamp producing sufficient illuminance on the target to meet the K-mark regulations and additional illumination on the ground is proposed and demonstrated. The phosphor-converted, white light emitting diode has a power demand of 2.5 W, while the novel design offers a maximum illuminance of 30 lux at the HV point, and illuminances larger than 3 lux across the first 7 m on the ground. The optical utilisation factor for the target illumination is 30% and for the ground is 44%. It means that around 74% of the luminous flux emitted by the phosphor-converted, white, light emitting diodes is utilised. This novel and highly efficient bicycle head lamp provides safer illumination for bicycle riders.

Reference:

“Design of a highly efficient LED-based bicycle head lamp with additional ground illumination”
J-Y Cai Y-C Lo S-T Feng C-C Sun
Lighting research & technology. , 2014, Vol.46(6), p.747-753

Read the full paper…

Filed Under: Safety

The effect of a ‘Share the Road’ sign on drivers passing bikes

12th May 2014 by Jody Muelaner Leave a Comment

This study looked at the effect of a “Share the Road” sign on the space that motorists gave to bicycles while overtaking.

There was a particular focus on roads fitted with centerline rumble strips which may cause motorists to pass closer to bikes. Cars were observed passing bikes on Michigan Highway and on a two-lane rural highway in Lower Peninsula. For each road two sections were chosen, one with a centerline rumble strip and one without. On each road section studies were carried out before and after a sign reading, “Share the Road” was fitted. Observations were made on clear days with good visibility.

Although the objective was to determine the effect of the “Share the Road” sign on drivers’ passing distance, other possible factors considered were:

  • The presence of rumble strips, hence there inclusion in the experimental design
  • Lateral position of bicycle in road, this was controlled by three controlled positions were used
  • Number of cyclists involved in passing maneuver
  • Type of vehicle (larger vehicles need more space and therefore tend to give bikes less room)
  • The presence of opposing traffic

Four pole-mounted, high-definition video cameras were used to monitor the passing distance of the cars. The distances were measured by project staff with results compared to ensure consistency. This method had a resolution of 0.15m. 1200 passing events were observed before the sign was installed and 1225 events were observed after it was installed.

Results are given with respect to:

  • Buffer distance: The lateral distance between the motor vehicle and the bike
  • Crowding: Defined as a buffer distance of less than 1.5m
  • Rightmost lane position: How far into the opposite lane the car moved
  • Speed: The speed of the massing motor vehicle

It was found that the sign did not significantly affect the buffer distance. The cyclist’s position did have an effect with the probability of crowding increased by 8 percent when riding at the outside edge of the hard shoulder and by 22 percent when on travel lane. The presence of opposing traffic increased the probability of crowding by 13 percent.

Abstract:

The interaction of motorists and bicyclists, particularly during passing maneuvers, is an area of concern to the bicycle safety community as there is a general perception that motor vehicle drivers may not share the road effectively with bicyclists. This is a particular concern on road sections with centerline rumble strips where motorists are prone to crowd bicyclists during passing events. One potential countermeasure to address this concern is the use of a bicycle warning sign with a “Share the Road” plaque. This paper presents the results of a controlled field evaluation of this sign treatment, which involved an examination of driver behavior while overtaking bicyclists. A series of field studies were conducted concurrently on two segments of a high-speed, rural two-lane highway. These segments were similar in terms of roadway geometry, traffic volumes, and other relevant factors, except that one of the segments included centerline rumble strips while the other did not. A before-and-after study design was utilized to examine changes in motor vehicle lateral placement and speed at the time of the passing event as they relate to the presence of centerline rumble strips and the sign treatment. Centerline rumble strips generally shifted vehicles closer to the bicyclists during passing maneuvers, though the magnitude of this effect was marginal. The sign treatment was found to shift motor vehicles away from the rightmost lane positions, though the signs did not significantly affect the mean buffer distance between the bicyclists and passing motorists or the propensity of crowding events during passing. The sign treatment also resulted in a 2.5 miles/h (4.0 km/h) reduction in vehicle speeds. Vehicle type, bicyclist position, and the presence of opposing traffic were also found to affect lateral placement and speed selection during passing maneuvers.

Reference:

Driver behavior during bicycle passing maneuvers in response to a Share the Road sign treatment
Kay, Jonathan J. (Wayne State University, Department of Civil and Environmental Engineering, 5050 Anthony Wayne Drive, Detroit, MI 48202, United States); Savolainen, Peter T.; Gates, Timothy J.; Datta, Tapan K. Source: Accident Analysis and Prevention, v 70, p 92-99, September 2014

Read the full paper…

Filed Under: Safety

Study shows risk factors for cyclists

9th May 2014 by Jody Muelaner Leave a Comment

A study has indicated that the major risk factors for cyclists are intersections, especially with poor visibility, poor road maintenance and other road users passing in front of the cyclist. However, the study involved a very limited sample with 16 cyclists (8 male, 8 female) riding instrumented bicycles for two weeks. The cyclists used the instrumented bicycles, instead of their own bikes, to carry out their normal cycling activities, such as commuting to work.

The instrumented bicycles were fitted with at least one forward video camera, two inertial measurement units, GPS, and two brake force sensors (one for each wheel). Data logging started automatically approximately two minutes after the cyclist began riding and stopped after two minutes without moving. Cyclists were asked to record any event which made them feel unsafe by pushing a button on the handlebars. Cyclists completed a pre-study questionnaire describing their riding habits and demographics. They also kept a trip diary reporting the purpose and duration of each ride and a post-study interview to describe any events that made them feel unsafe. Critical events were indicated when the cyclist pushed the button, reported something in the post-study interview or when inertial measurement indicated an event. Each of these potential events was verified and categorized by viewing the recorded video.

It is noted in the paper that previous research had shown that 70% of European cycle accidents do not involve another road user. However, most fatal accidents involve a motor vehicle. Due to the small sample size, these more serious types of collisions would not be expected to be encountered. Therefore near-collisions were used as surrogates. Identifying when such an incidence has occurred is somewhat subjective.

When an event was recorded it was also noted whether a number of factors were present. These were divided into environmental factors and threats. Environmental factors included: daylight; bike lane; asphalt; paved surface; slippery surface; holes in road surface; intersection; intersection with poor visibility; construction works; and a motor vehicle parked on the bike lane. Threats were defined as another road user crossing the cyclist’s path: light vehicle; heavy vehicle; pedestrian; bicycle; or animal.

The conclusion was that cycling close to an intersection increased the risk of a critical event by four times. This is increased to twelve times when there is poor visibility at the intersection, for example a building or hedge blocking the view. Holes in the road surface increased the risk by ten times and a pedestrian or cyclist crossing the riders path increased the risk by two times. Since most serious accidents involve a motor vehicle, and these are most likely at intersections with poor visibility, the most important advice seems to be for cyclists to improve their visibility, especially from the side.

Abstract:

Presently, the collection and analysis of naturalistic data is the most credited method for understanding road user behavior and improving traffic safety. Such methodology was developed for motorized vehicles, such as cars and trucks, and is still largely applied to those vehicles. However, a reasonable question is whether bicycle safety can also benefit from the naturalistic methodology, once collection and analyses are properly ported from motorized vehicles to bicycles. This paper answers this question by showing that instrumented bicycles can also collect analogous naturalistic data. In addition, this paper shows how naturalistic cycling data from 16 bicyclists can be used to estimate risk while cycling. The results show that cycling near an intersection increased the risk of experiencing a critical event by four times, and by twelve times when the intersection presented some form of visual occlusion (e.g.; buildings and hedges). Poor maintenance of the road increased the risk tenfold. Furthermore, the risk of experiencing a critical event was twice as large when at least one pedestrian or another bicyclist crossed the bicyclist’s trajectory. Finally, this study suggests the two most common scenarios for bicycle accidents, which result from different situations and thus require different countermeasures. The findings presented in this paper show that bicycle safety can benefit from the naturalistic methodology, which provides data able to guide development and evaluation of (intelligent) countermeasures to increase cycling safety.

Reference:

Introducing naturalistic cycling data: What factors influence bicyclists’ safety in the real world?
Dozza, Marco (Chalmers University of Technology, Department of Applied Mechanics, Division of Vehicle Safety, Lindholmspiren 3, 41296 Gothenburg, Sweden); Werneke, Julia Source: Transportation Research Part F: Traffic Psychology and Behaviour, v 24, p 83-91, May 2014

Read more…

Filed Under: Safety

Calculating Hub Gear Efficiency

17th April 2014 by Jody Muelaner Leave a Comment

CAD model of Epicyclic gears

Simplified method to calculate epicyclic transmission efficieny early in design

Standard methods for analyzing transmission efficiencies assume that all of the power flows through each gear in a sequence. In a hub gear, the planetary gear trains (PGTs) or epicyclic gear trains involve a number of planet gears transferring power in parallel. This requires special methods for efficiency analysis which are often time consuming to perform. This paper presents a simplified method. It has been validated against previously published results and may be useful for the evaluation of proposed designs.

The method in this paper only considers gear-mesh loses, caused by the sliding friction when the teeth mesh together, which normally provides a reasonably accurate calculation of efficiency. The procedure has the following steps:

  1. List all fundamental circuits, consisting of two meshing geats and a carrier. For each, carry out kinematic analysis to solve for the angular speed of each link.
  2. Find the idealized torque of each link, assuming there is no power loss.
  3. Identify the direction in which power is flowing through each link
  4. Add gear-mesh losses for each gear pair, giving the actual torque of each link
  5. Sketch a power flow diagram and calculate the overall efficiency

The paper goes step-by-step through a method of calculating the efficiency of a hub gear system. If you want to perform the calculations you’ll need to read the full paper.

Abstract:

Purpose

The analysis of power flow and mechanical efficiency constitutes an important phase in the design and analysis of gear mechanisms. The aim of this paper is to present a systematic procedure for the determination of power flow and mechanical efficiency of epicyclic-type transmission mechanisms.

Design/methodology/approach

A novel epicyclic-type in-hub bicycle transmission, which is a split-power type transmission composed of two transmission units and one differential unit, and its clutching sequence table are introduced first. By using the concept of fundamental circuits, the procedure for calculating the angular speed of each link, the ideal torque and power flow of each link, the actual torque and power flow of each link determined by considering gear-mesh losses, and the mechanical efficiency of the transmission mechanism is proposed in a simple, straightforward manner. The mechanical efficiency analysis of epicyclic-type gear mechanisms is largely simplified to overcome tedious and complicated processes of traditionally methods.

Findings

An analysis of the mechanical efficiency of a four-speed automotive automatic transmission completed by Hsu and Huang is used as an example to illustrate the utility and validity of the proposed procedure. The power flow and mechanical efficiency of the presented 16-speed in-hub bicycle transmission are computed, and the power recirculation inside the transmission mechanism at each speed is detected based on the power flow diagram. When power recirculation occurs, the mechanical efficiency of the gear mechanism at the related speed reduces. The mechanical efficiency of this in-hub bicycle transmission is more than 96 percent for each speed. Such an in-hub bicycle transmission possesses reasonable kinematics and high mechanical efficiency and is therefore suitable for further embodiment design and detail design.

Originality/value

The proposed approach is suitable for the mechanical efficiency analysis of all kinds of complicated epicyclic-type transmissions with any number of degrees of freedom and facilitates a less-tedious process of determining mechanical efficiency. It is a useful tool for mechanical engineering designers to evaluate the efficiency performance of the gear mechanism before actually fabricating a prototype as well as measuring the numerical data. It also helps engineering designers to cautiously select feasible gear mechanisms to avoid those configurations with power recirculation in the preliminary design stage which may significantly reduce the time for developing novel in-hub bicycle transmissions.

Reference:

Computing the power flow and mechanical efficiency of in-hub bicycle transmissions

Wu, Yi-Chang; Cheng, Chia-Ho, 2014

In: Engineering Computations (Swansea, Wales) v 31, n 2

Read the full paper…

Filed Under: Speed

Danish study shows how cyclists can reduce accident risks

14th March 2014 by Jody Muelaner Leave a Comment

Researchers at the Technical University of Denmark have analyzed police records to understand risk factors for cyclists. This showed that the probability of cyclist injury severity increases with:

  • Age under 10 years and over 40 years
  • Alcohol consumption: Drunk cyclists are 60% more likely to die when wearing a helmet and 457% more likely to die when not wearing a helmet.
  • Collision with a truck: This is 1,145% more likely to result in death than for other vehicles
  • Although cycle lanes do not reduce minor or severe accidents they do reduce fatalities
  • Slippery road surfaces increase the risk of fatalities by 48%
  • Road speeds over 50 kph increase the risk of severe and fatal accidents: speed limits of 50–60 km/h increase the risk of fatalities by 21–45% while for speed limits above 70 km/h this increased to 274–326%.

The database used contained 8,892 accident records reporting on the accident, persons involved and vehicles involved. 24% involved serious cyclist injuries and 1.7% cyclist fatalities.

The accident reports give the accident type, weekday, time of day, severity level, collision manner, road users, infrastructure characteristics, land use, and light and weather conditions. The associated person file gives demographics, alcohol or drug use, seat belt or helmet use, license validity, and injury severity of the persons involved. The vehicle file details the make and model, maneuver prior to the accident, weight, registration date, and collision point of the vehicles involved. Accidents which did not involve another person or vehicle were excluded since these types of accident are known to be very under-reported.

95% of accidents involved motorized vehicles and 71% occurred at intersections. Half of the accidents involved a cyclist riding straight and the driver turning, this is a clear warning that cyclists need to be highly defensive, anticipating drivers moving into their path. 81% of the accidents occurred during daylight and 75% on dry surfaces. Only 2% of cyclists and 1.4% of the people they collided with had blood alcohol over the legal limit. The statistical method of discrete choice modeling was used to identify which factors had a significant effect on injury severity.


Abstract:

Introduction: Denmark is one of the leading cycling nations, where cycling trips constitute a large share of the total trips, and cycling safety assumes a top priority position in the agenda of policy makers. The current study sheds light on the aggravating and mitigating factors associated with cyclist injury severity on Danish roads by examining a comprehensive set of accidents involving a cyclist and a collision partner between 2007 and 2011. Method: This study estimates a generalized ordered logit model of the severity of cyclist injuries because of its ability to accommodate the ordered-response nature of severity while relaxing the proportional odds assumption. Results: Model estimates show that cyclist fragility (children under 10 years old and elderly cyclists over 60 years of age) and cyclist intoxication are aggravating individual factors, while helmet use is a mitigating factor. Speed limits above 70-80 km/h, slippery road surface, and location of the crash on road sections are aggravating infrastructure factors, while the availability of cycling paths and dense urban development are mitigating factors. Heavy vehicle involvement and conflicts between cyclists going straight or turning left and other vehicles going straight are aggravating vehicle involvement factors. Practical applications: The results are discussed in the context of applied policies, engineering, and traffic management solutions for bicycle safety in Denmark

Reference:

Aggravating and mitigating factors associated with cyclist injury severity in Denmark
Sigal Kaplan Konstantinos Vavatsoulas Carlo Giacomo Prato
Journal of safety research. , 2014, Vol.50, p.75-82

Read the full paper…

Filed Under: Safety

Observations on cycle paths in Amsterdam and Eindhoven

13th March 2014 by Jody Muelaner Leave a Comment

This study used video observations of cyclists and moped riders on busy cycle paths in Amsterdam and Eindhoven. It is noted that previous research has shown that about three-quarters of cyclists hospitalized by a crash were not involved with a motor vehicle. 62% were involved in a single-bicycle crash and an additional 12% crashed with another bicycle. As cycle paths become more busy with a wide variety of bikes, ebikes and light mopeds safety becomes an increasing concern.

CCTV video was recorded as series of jpeg images. Initially, traffic counts were made for bicycles, mopeds, and pedestrians by human observers. Standard traffic conflict techniques (TCT) were then used so that the probability of collisions could be determined from the Time-To-Collision (TTC) and post-encroachment time (PET). During the study 40 serious conflicts (severity score 3–5) were observed in Amsterdam, which where were mainly other riders or pedestrians crossing the cyclist’s path, with two actual collisions. Both with pedestrians crossing the cyclist’s path. There were far fewer series conflicts in Eindhoven. It was also observed that most mopeds were traveling well above the speed limit of 25 kph.

Abstract:

In The Netherlands, on bicycle paths, single-bicycle accidents, bicycle-bicycle and bicycle-moped accidents constitute a considerable share of all bicyclist injuries. Over three quarters of all hospitalised bicyclist victims in the Netherlands cannot be directly related to a crash with motorised traffic. As the usage of bicycle paths steadily increases, it is to be expected that safety on bicycle paths will become a major issue in the coming years in The Netherlands. A study was conducted into the behaviour of bicyclists and moped riders to improve traffic safety on bicycle paths. By behavioural observations with video, mutual conflicts and bicyclist behaviour on bicycle paths were recorded and analysed, among other things by means of the conflict observation method DOCTOR (Dutch Objective Conflict Technique for Operation and Research). The explorative phase of the study (phase 1), included two research locations, one in the city of Amsterdam and one in Eindhoven. The results gave guidance for a better understanding of the behaviour between different users of separate two-directional bicycle paths. An example includes the relationship between bicyclist-moped rider behaviour and the width of the bicycle path. For a condition with busy bicycle traffic in both directions the width of the bicycle path in Amsterdam (effectively 3.55 m) is relatively narrow, whereas the bicycle path width in Eindhoven (>4.94 m) appears to be sufficient to accommodate large flows of bicyclists. Because of a large flow of crossing pedestrians resulting in (severe) conflicts with bicyclists in Amsterdam, additional countermeasures to better control these interactions are needed. The DOCTOR conflict observation method from video appears to be applicable for conflicts between intersecting road users and for head-on conflicts on the bicycle path. Conflict situations between bicyclists in the same direction (constituting an important share of injury accidents on bicycle paths) require an additional and more general systematic observation of specific behaviour. Therefore, phase 2 of the project will focus in particular on interactions between bicycle path users in the same direction and underlying processes.

Reference:

Traffic conflicts on bicycle paths: A systematic observation of behaviour from video
A Richard A van der Horst Maartje de Goede Stefanie de Hair-Buijssen Rob Methorst
Accident analysis and prevention. , 2014, Vol.62, p.358-368

Read the full paper…

Filed Under: Safety

AI spots dangerous cycling at intersections

10th March 2014 by Jody Muelaner Leave a Comment

A method of detecting cyclists at intersections has been developed which allows dangerous situations to be identified. Traffic monitoring cameras were used together with image processing which can automatically detect cyclists. The trajectory of the cyclists can then be tracked and potentially dangerous trajectories identified.

Series of segmented images for different types of vehicles
Image processing used to identify cyclists

In this paper, it is noted that previous research has shown that most bicycle accidents are caused by the cyclist themselves making a mistake. The most common mistakes are made during a turn (53%) and disregarding the right of way (22%), for example riding in the wrong direction against the traffic or entering a road without right of way. The objective of this research was, therefore, to identify such atypical trajectories for the movement of bicycles through an intersection. Examples include U-turns, red light violations, sudden and hard braking or cutting across the roadway diagonally. However, rather than define such situations explicitly, the researchers employed machine learning to identify atypical trajectories.

An atypical trajectory is not necessarily a dangerous one and two well-known traffic safety parameters were used to indicate the level of risk involved in atypical trajectories. The first parameter, Time to Collision (TTC) is the expected time for two objects to collide. This was determined using an Extended Kalman Filter. A low TTC indicates a dangerous situation and occurred frequently when cyclists were turning across the follow of traffic. In this case, this meant turning left since the study was carried out in Berlin with traffic traveling on the right-hand side of the road. This is known to be a common situation for an accident to occur. The second parameter, the Post-Encroachment-Time (PET), is the time by which two objects miss each other when their paths cross. It is not clear to me reading the paper why it is necessary to first identify atypical trajectories if the known parameters TTC and PET are what actually indicates danger.

It is intended by the researchers that the method will be used to analyze intersections and recommend changes to the infrastructure to improve safety.

Abstract:

Over the past years, the bicycle has gained importance as a means of transportation in big cities. The use and acceptance of a bicycle as being an evolving means of transportation is highly linked to its transportation safety. Still, the risk of accidents is a dominant barrier. Even though the Federal Ministry of Transport, Building and Urban Development established a National Cycling Plan to enhance cycling and improve safety aspects, serious accidents still occur. Even if the number of traffic accidents is declining in Berlin, the consequences of bicycle accidents with physical injury are characterised by increasing results. Thus, it is proved that more than half of the accidents that involve bicyclists are caused by the cyclist itself. To understand causes of accidents and to eventually arrange preventive measures and enhance cyclists’ safety, critical situations were detected. The application is based on cyclists’ trajectories generated from video sequences. As a result, atypical and dangerous traffic situations can be identified automatically whereas rule violations can be detected manually. First experiences at an intersection in Berlin show a general applicability of this approach, which has to be widely tested at other intersections.

Reference:

Analysis of traffic safety for cyclists: The automatic detection of critical traffic situations for cyclists
Detzer, S. (German Aerospace Center, Institute of Transportation Systems, Traffic Management (DLR), Germany); Junghans, M.; Kozempel, K.; Saul, H. Source: WIT Transactions on the Built Environment, v 138, p 491-502, 2014, Urban Transport XX

Read the full paper…

Filed Under: Safety

Study gives insight in pedestrians injured by cyclists

8th March 2014 by Jody Muelaner Leave a Comment

A study has been carried out to show the extent and type of injuries sustained by pedestrians as a result of being hit by bicycles. It examined patient records from hospitals in New York and California, involving pedestrians who were injured by cyclists between 2004 and 2011. The samples do not include persons who were treated by their doctor or who did not receive any medical treatment. These samples consisted of 7409 in New York State and 6177 in California.

The most notable observation was that the numbers of pedestrians injured by cyclists declined after 2008 while the number of cyclists was increasing. Possible explanations given are less exposure of children to cyclists and improved cycle paths effectively separating cyclists from pedestrians. The data also shows the most common primary diagnoses. For outpatients, these were: injuries (23.8%), open wounds (18.4%), contusions (16.5%), and pain (11.2%). For inpatients, they were: fractures (61.6%), injuries (9.6%), hemorrhages (8.3%), and concussions (7.6%).

Abstract

Introduction Scant attention has been given to pedestrians injured in accidents resulting from collisions with cyclists. This scholarly neglect is surprising given the growing popularity of cycling. This study examines the incidence of pedestrians injured by cyclists in New York between 2004 to 2011 and in California from 2005 to 2011. The study also profiles the pedestrians injured in these two states during these two time frames. Method The data for this study are based upon patient-level hospital records from New York and California. The data for New York comes from the Statewide Planning and Research Cooperative System (SPARCS) under the auspices of New York State’s Department of Health. The data for California come from two sources: the Healthcare Cost and Utilization Project (HCUP) and the California Office of Statewide Health Planning and Development. Results The rate of pedestrians injured in collisions with cyclists has decreased over time. This decline has occurred despite the increase in the number of cyclists in these states during this same time period. Two possible explanations for this decline are: (a) less exposure of children to cyclists, and (b) improvements in the cycling infrastructure. Practical applications Although the rate of injuries to pedestrians from collisions with cyclists has been decreasing, improvements to the cycling infrastructure will need to continue. Bike lanes, particularly protected bike lanes, have been shown to be an effective way of reducing cycling-pedestrian accidents. The results of the current study are consistent with this research. Educational campaigns aimed at cyclists that emphasize the safety of all road users – including pedestrians – will also need to continue to assure that this downward trend in the number of accidents is not reversed.

Reference:

Pedestrian injuries due to collisions with bicycles in New York and California

Tuckel, Peter (Department of Sociology, Hunter College – City University of New York, 695 Park Avenue, New York; NY, United States); Milczarski, William; Maisel, Richard Source: Journal of Safety Research, v 51, p 7-13, December 2014

Read the full paper…

Filed Under: Safety

  • « Go to Previous Page
  • Page 1
  • Page 2
  • Page 3
  • Page 4
  • Page 5
  • Go to Next Page »

Primary Sidebar

Coming soon – the fastest folder?

Folding bike animation

Follow Us

  • Facebook
  • X
  • LinkedIn
  • Instagram
  • YouTube
Privacy & Cookies: This site uses cookies. By continuing to use this website, you agree to their use.

To find out more, including how to control cookies, see here: Cookie Policy

Patented: GB2605862

European patent pending

  • Facebook
  • LinkedIn
  • EDI Policy
  • Privacy Policy