• Skip to main content
  • Skip to primary sidebar

Better Bicycles

Science and cyclists making better bikes for transport and leisure

  • Mission
  • BriefBike
    • FAQ
  • About us
  • Contact
  • More
    • News
    • Research
    • Reviews
You are here: Home / Science / Speed / Model for Speed and Power in Track Cycling

Model for Speed and Power in Track Cycling

8th March 2018 by Jody Muelaner Leave a Comment

Sophisticated model including slip and steering angles shows accuracy within 0.2 percent

This study sought to improve on the accuracy of existing models for the speed of a track cyclist. It was based on the governing equation:

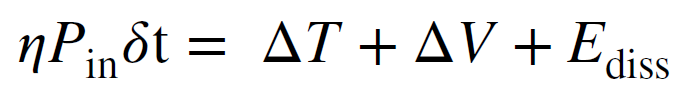
where η is the transmission efficiency, Pin is the power delivered by the cyclist, dt is a discrete period of time, ΔT is the change in kinetic energy, ΔV is the change in potential engery and Edis is the energy disipated by resistance forces.

The energy dissipation is calculated considering the usual resistance forces such as aerodynamic drag and rolling resistance. Significant improvements in accuracy were given by accounting for kinetic energy, including rotational, and varying rolling resistance due to cornering. This resulted in a high accuracy of predicted lap times with errors consistently less than 0.36 percent.

Abstract:

A review of existing mathematical models for velodrome cycling suggests that cyclists and cycling coaches could benefit from an improved simulation tool. A continuous mathematical model for cycling has been developed that includes calculated slip and steering angles and, therefore, allows for resulting variation in rolling resistance. The model focuses on aspects that are particular, but not unique, to velodrome cycling but could be used for any cycling event. Validation of the model is provided by power meter, wheel speed and timing data obtained from two different studies and eight different athletes. The model is shown to predict the lap by lap performance of six elite female athletes to an average accuracy of 0.36% and the finishing times of two elite athletes competing in a 3-km individual pursuit track cycling event to an average accuracy of 0.20%. Possible reasons for these errors are presented. The impact of speed on steering input is discussed as an example application of the model.

Reference:

A mathematical model for simulating cycling: applied to track cycling Fitton, B., Symons, D. 2018

Sports Engineering
21(4), pp. 409-418

Read the full paper…

Filed Under: Speed

Reader Interactions

Let us know what you thinkCancel reply

This site uses Akismet to reduce spam. Learn how your comment data is processed.

Primary Sidebar

Coming soon – the fastest folder?

Folding bike animation

Follow Us

  • Facebook
  • X
  • LinkedIn
  • Instagram
  • YouTube
Privacy & Cookies: This site uses cookies. By continuing to use this website, you agree to their use.

To find out more, including how to control cookies, see here: Cookie Policy

Patented: GB2605862

European patent pending

  • Facebook
  • LinkedIn
  • EDI Policy
  • Privacy Policy